I should probably preface this with the following:
I really love NestJS.
There’s something magical about the DI system and Typescript decorator pattern in NestJS. Not having to worry about passing around dependencies and handing things off to the DI container means being able to scaffold out applications quickly and worry less about things like:
“Where do I import the logger from?”
“How will I get the database handler in here?”
“Ugh, I need those service methods from that other module.”
For this reason, I’ve written a lot of backend applications in NestJS. And today, we’re going to talk about one of these applications and how moving away from my favorite Javascript framework to Go unlocked massive performance gains that I couldn’t have ever expected.
The Core Issue Link to heading
The company I currently work at has a primary product called Combobulate, a powerful and flexible Content Management System. One of the challenges we faced as this product grew was the previously manual process of setting up and maintaining the CDN infrastructure for each tenant.
To solve this, I wrote a simple microservice proxy that worked with the configuration microservice (another application we wrote in NestJS) to route content requests to various targets based on the incoming request. With this in place, we could now use one centralized content CDN for all the installations, handle various caching and audit methods in one place, and spinning up new CMSs only meant dealing with the actual CMS installation and not the infrastructure.
However, I knew that we might eventually hit limits on what it could handle, given that, in some circumstances, it could be processing and serving back many GBs of data a day with busier tenants who saw frequent changes. I figured that one day, this service would need to be rewritten to something more efficient.
That day came in April.
The Cost of Javascript Link to heading
One day in April, I was looking into the cluster and noticed that our proxy had scaled up to over a dozen pods and was consuming quite a lot of resources in our us-east production cluster. The memory usage of the proxy had grown to over a GB for just baseline usage, and we had yet to migrate all of the largest tenants over to the new system. This would fail to bode well for our largest tenants, who would make daily updates with GBs of content, as the cost of simply running the proxies would negate the developer time cost of the initial infrastructure setup.
I tried some initial attempts at optimizations, but after they proved to not do enough, I started to think about more heavy-handed approaches to improve the proxy’s performance.
The Move to Fiber Link to heading
Being primarily in DevOps, I have been writing Go for quite a while, mostly Kubernetes Operators and CLI tooling with Cobra. However, one day, a coworker pointed me at this somewhat new Go framework using fasthttp that was topping performance benchmarks called Go Fiber, promising some pretty insane results. Given that I had primarily worked with Express to write APIs, the syntax looked right at home. After a few exploratory projects, Go Fiber has become my new favorite API framework for my personal projects.
Fast forward to the events above, and I began scaffolding out the components one by one into Go Fiber. Given the similarity in syntax, it took only a few days to port all of the logic over. It was one of the most enjoyable experiences I have ever had in writing APIs (though this could have been the lack of a deadline hovering over my head, as PM had no idea I was doing this).
After a few days, the logic had been ported over, and I was confident. I had taken the time to get complete code coverage on the application, unit-tested almost all of the logic, and prepared the app for further changes I knew would be coming down the pipeline later. There were only a few things left to do regarding setting up the pipeline in Jenkins, and given that PM still had no idea I was doing this (sorry, Ashley), I thought to myself:
How many requests can this thing handle…
I had done some initial load testing with ApacheBench to validate performance, but I hadn’t pushed the system to its limits. So, I pulled out my favorite load-testing tool, Grafana K6.
The Load Test Link to heading
To test the performance of both applications side by side, I wrote a few simple K6 scripts, one of these being the load test for serving the content out of S3 which would take up a bulk of the requests coming in. The script behavior worked as follows:
- Sequentially fetch the main SPA bundle assets
- Sequentially fetch the 10 largest content assets by size
- Sleep for 1 second
It was a simple script to put the proxy under the point of heaviest load, which would typically be on loading the main page immediately after new content publishes, with this also removing the CDN edge servers and browser-side caching from the equation.
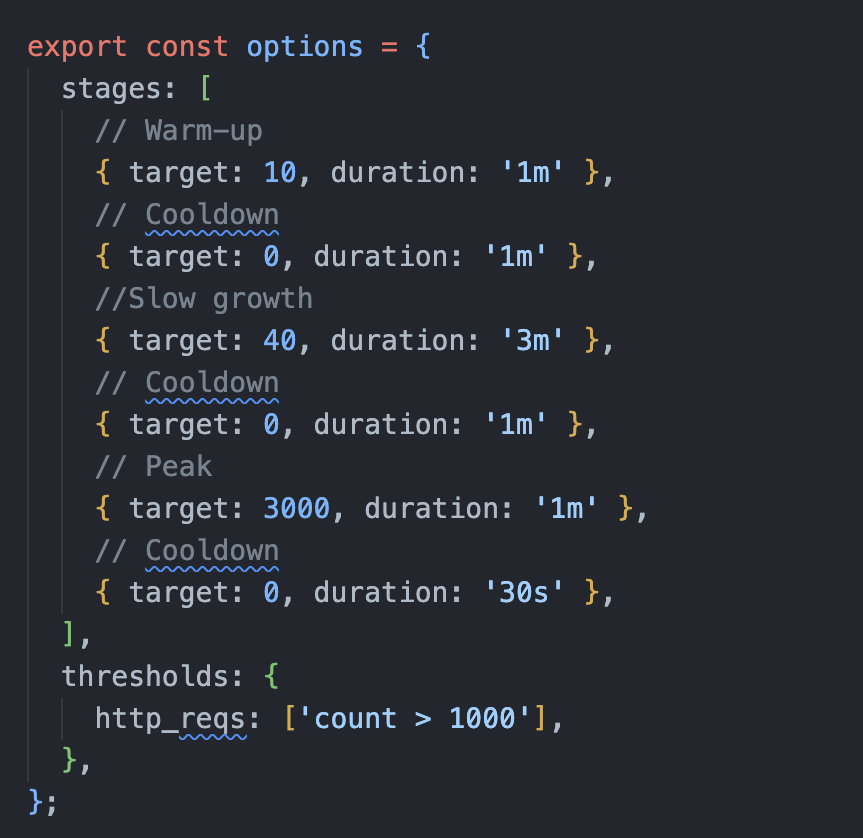
To simulate various levels and kinds of loads, the K6 script used the following scenarios:
So to summarize, the test would go through the following stages of the script run:
- Gradually increase to 10 concurrent users over 1 minute (Typical base load, post-CloudFront)
- Gradually decrease back down to 0 concurrent users over 1 minute
- Gradually increase to 40 concurrent users over 3 minutes (Typical peak load, post-CloudFront)
- Hold at 40 concurrent users for 1 minute
- Gradually decrease back down to 0 concurrent users over 1 minute
- Peak to 3000 concurrent users over 1 minute (Me wanting to break things)
- Cool down to 0 concurrent users over 1 minute
FYI - I only went up to 10, 40, and 3000 concurrent users, given the above notion that the CDN and the browser side caching were eliminated from the equation, and each user is making over a dozen requests for each iteration. CloudFront carries most of the weight here, serving repeated requests from edge servers.
Both applications were deployed to an EKS cluster running 1.24, with 3 dedicated m5a.2xlarge nodes spread across 3 availability zones for the test. Both applications were configured as follows:
- Anti-affinity to ensure each pod was scheduled on a separate node (and, by extension, AZ)
- Resource limits removed to eliminate any throttling
- HPA and node autoscaling disabled to prevent scaling buffers
The K6 script was run using the Grafana K6 Operator, running the load from a separate cluster in the same VPC, of which Prometheus metrics were exported to our Grafana Mimir cluster, and visualized within Grafana.
PS - Can you tell that I love Grafana Labs software <3
The Results Link to heading
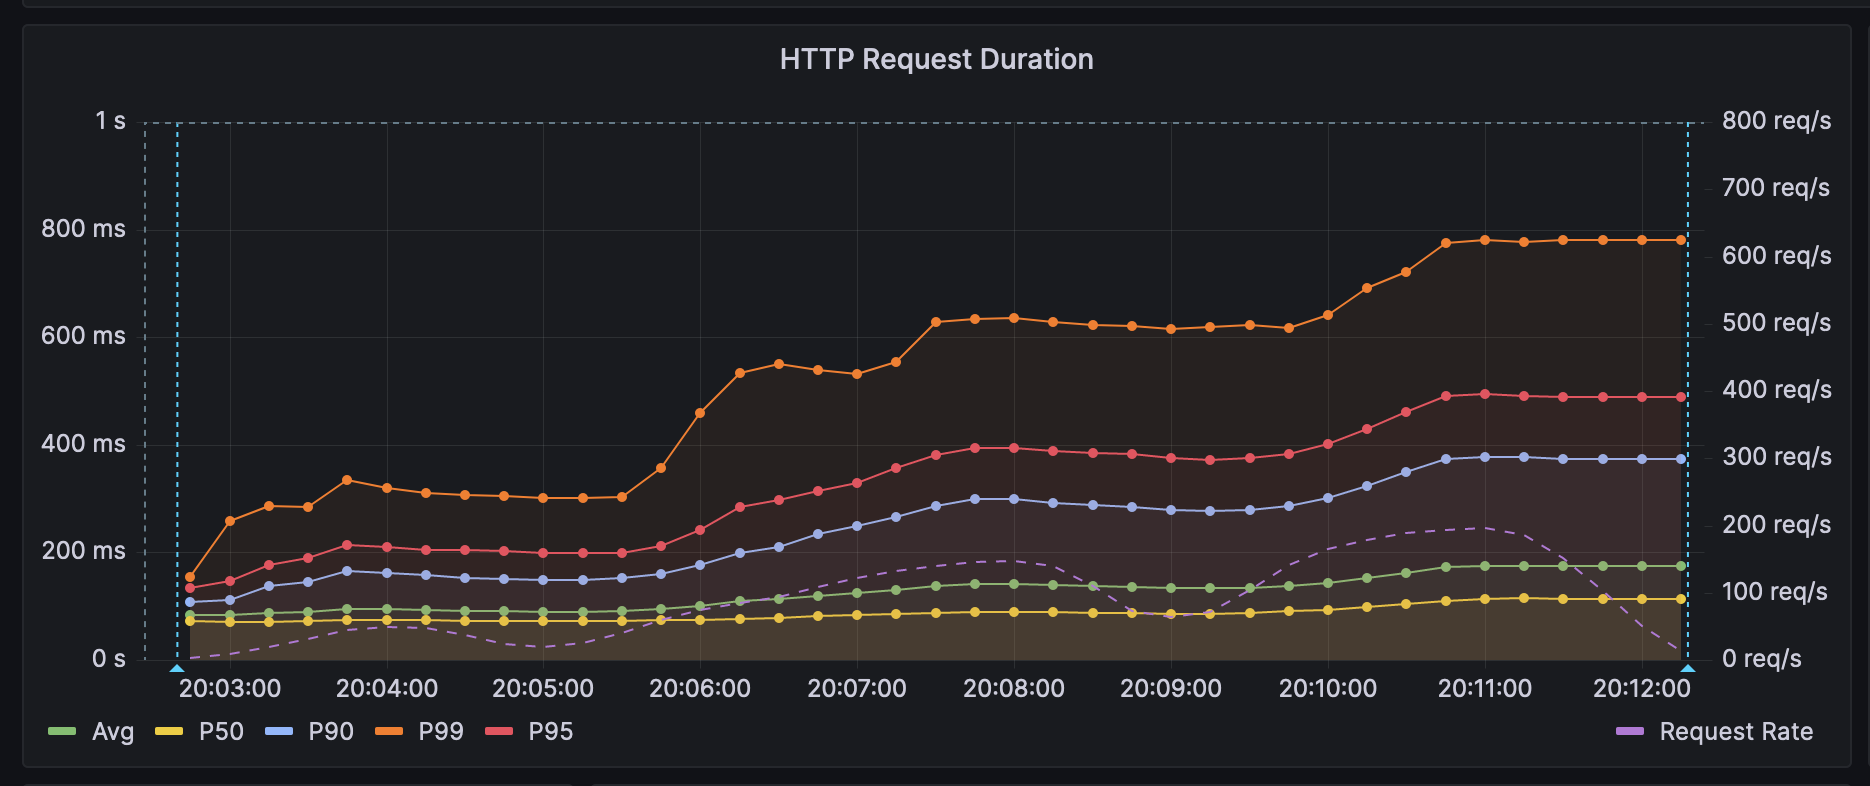
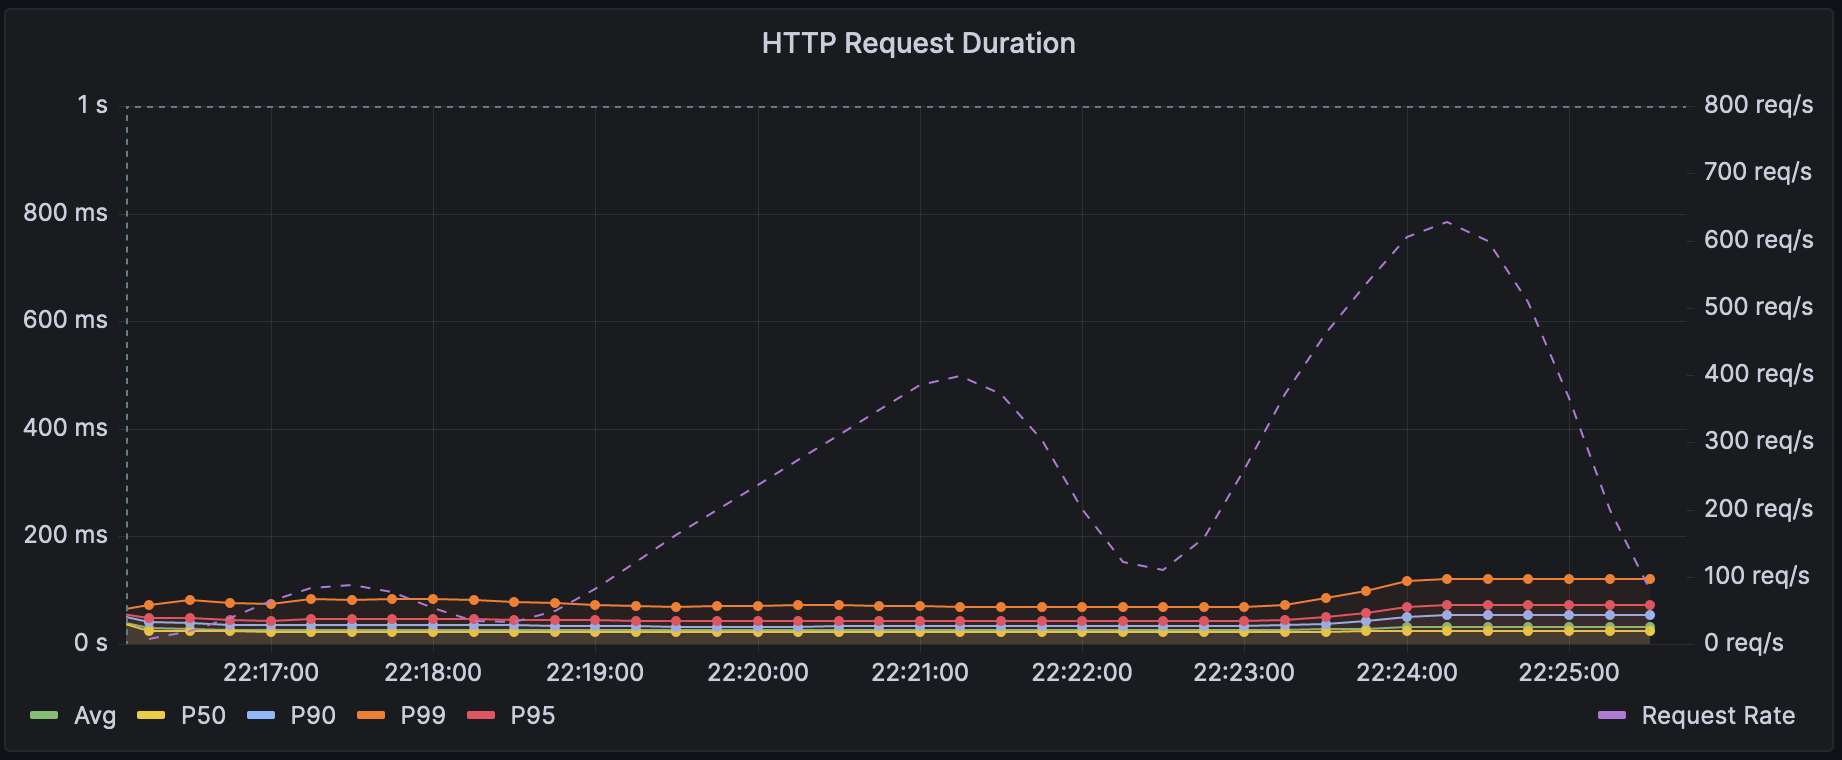
The graphs below represent the P distribution of the response times for each application, with the lines in the foreground representing the P-distribution of response times (measures against the left axis) and the faint line in the background representing the achieved RP (measured against the right axis).
NestJS (Fastify) Link to heading
Go (Fiber) Link to heading
| Metric | NestJS | Go Fiber | % Improvement |
|---|---|---|---|
| Baseline Memory Usage | 286 MB | 171 MB | 67% |
| Peak CPU Usage | 3.1m | 1.25m | 148% |
| Peak Memory Usage | 7180 MB | 987 MB | 675% |
| GB Transmitted | 17 GB | 53 GB | 320% |
I was absolutely blown away by the results. Not only was the proxy able to serve over 3x the content, but it was also able to do so with less than 1/2 the computing power, 1/8th the memory usage, and 1/7th the response time for the 99th percentile. No logic had changed in the rewrite. I was so excited to show this to the team, and even though I was expecting some pushback given the team’s primary expertise in NodeJS, they were quickly enthralled with the performance. So, after some quick updates (and apologies) for PM, we successfully migrated to the new proxy by the end of the week, and after a tiny change to logging, it has been working flawlessly now for weeks.
So, what’s my conclusion here?
I’m going to start writing more things in Go Fiber.
UPDATE: August Link to heading
This rewrite has yet to need to scale, even after migrating the two largest tenants and seeing our CDN serving out sometimes multiple TBs of content per day. Count it a win in the books for Go!


